Rising Youth Unemployment in India a Cause for Concern: Skill Development Will Need to Factor Global Shifts
Two demographic shifts are increasingly seen to be transforming global economies and labour markets: aging and declining working-age populations, predominantly in the developed economies, and expanding working-age populations, predominantly in the less developed economies.
 Sep 01, 2025
")
The Periodic Labour Force Survey (PLFS) is conducted by the National Statistics Office (NSO) under India's Ministry of Statistics and Programme Implementation (MoSPI). Launched in April 2017, the survey was designed to provide more frequent and timely estimates of key employment and unemployment indicators in a country of 1.4 billion people, both at the all-India level and across rural and urban regions.
PLFS releases monthly estimates of the Labour Force Participation Rate (LFPR), Worker Population Ratio (WPR), and Unemployment Rate (UR) using the Current Weekly Status (CWS) approach. These estimates are disaggregated by gender, sector, and broad age group and are published in the form of monthly bulletins.
The activity status of an individual is determined based on their activities during a specified reference period. Under CWS, this reference period is the seven days preceding the date of the survey. A person’s status is thus classified according to whether they were employed, unemployed, or outside the labour force during that week.
Labour Force Participation
Key Labour Indicators Show Rising Youth Unemployment (15–29 Years), April–July 2025
Labour Force Participation Rate (LFPR) refers to the percentage of the population that is either employed or actively seeking employment. In other words, it indicates the share of people who are working or willing to work.
The labour force includes all individuals who supply or offer to supply labour for the production of goods and services. This encompasses both the employed and the unemployed. Under the Current Weekly Status (CWS) approach, the labour force is defined as the number of persons who were either employed or unemployed on average during the seven days preceding the survey date.
Figure 1: Labour Force Participation Rate - Age 15-29 Years (Rural)
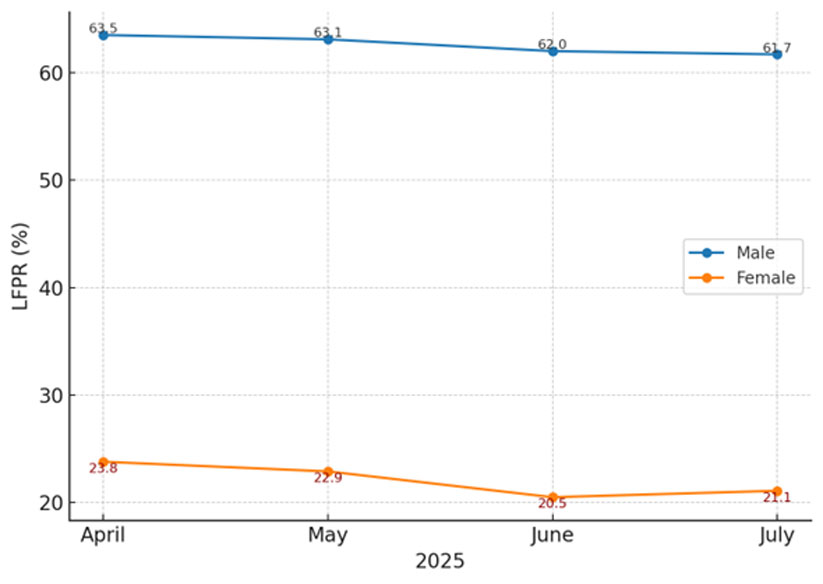
Source: Monthly Bulletin Periodic Labour Force Survey (PLFS) JULY 2025 https://www.mospi.gov.in/sites/default/files/publication_reports/Monthly%20Bulletin%20PLFS%20July%202025.pdf
Figure 2: Labour Force Participation Rate - Age 15-29 Years (Urban)
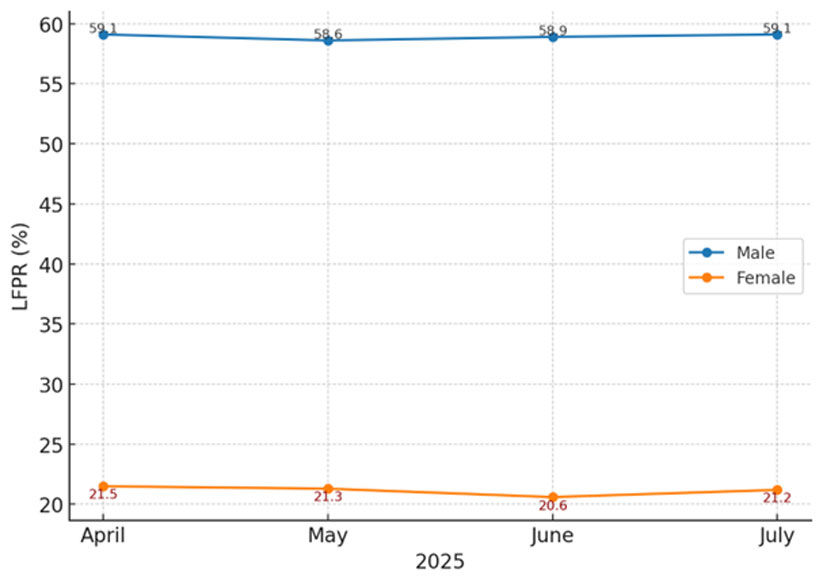
Source: Monthly Bulletin Periodic Labour Force Survey (PLFS) JULY 2025 https://www.mospi.gov.in/sites/default/files/publication_reports/Monthly%20Bulletin%20PLFS%20July%202025.pdf
Figure 3: Labour Force Participation Rate - Age 15-29 Years (Rural + Urban)
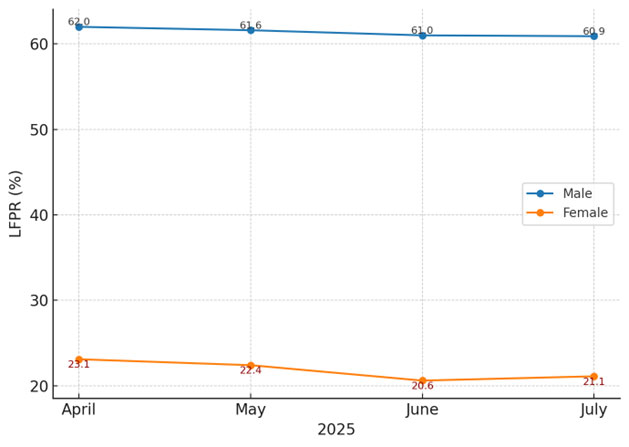
Source: Monthly Bulletin Periodic Labour Force Survey (PLFS) JULY 2025 https://www.mospi.gov.in/sites/default/files/publication_reports/Monthly%20Bulletin%20PLFS%20July%202025.pdf
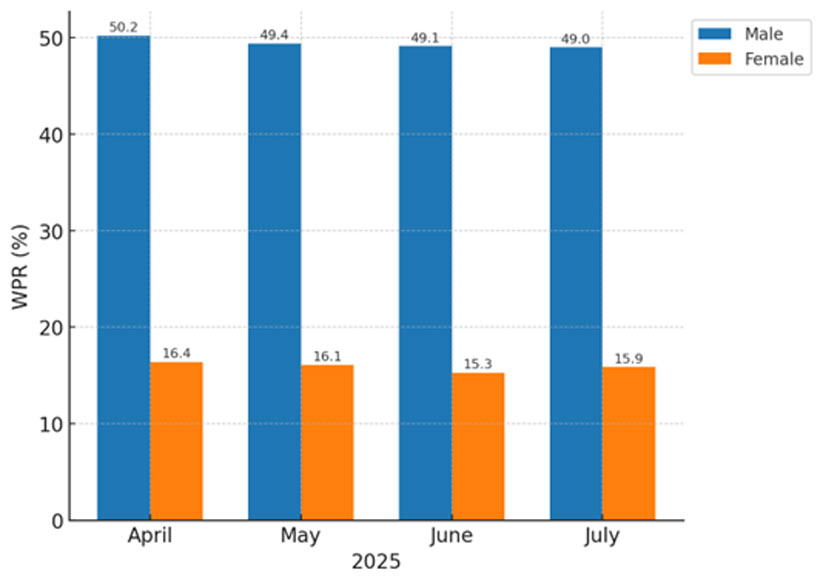
Worker Population Ratio (WPR)
The Worker Population Ratio (WPR) measures the proportion of the population that is employed. It is calculated as the number of employed individuals divided by the total population, and reflects how many people are actively engaged in producing goods and services.
Under the Current Weekly Status (CWS) approach, WPR offers a short-term snapshot of the workforce. A person is considered employed if they worked for at least one hour on any day during the seven days preceding the survey date. This method provides an estimate of the average workforce during the reference week, highlighting the extent of actual work participation within the population.
Figure 4: Worker Population Ratio - age 15-29 Years (Rural)
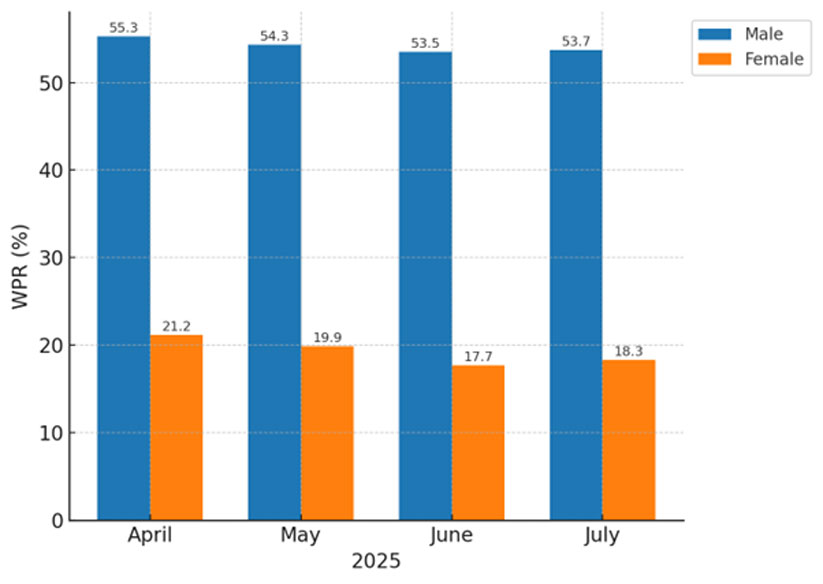
Source: Monthly Bulletin Periodic Labour Force Survey (PLFS) JULY 2025 https://www.mospi.gov.in/sites/default/files/publication_reports/Monthly%20Bulletin%20PLFS%20July%202025.pdf
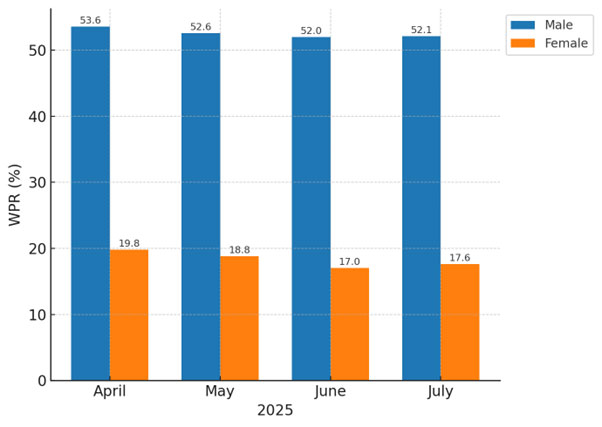
Figure 5: Worker Population Ratio - Age 15-29 Years (Urban)
Source: Monthly Bulletin Periodic Labour Force Survey (PLFS) JULY 2025 https://www.mospi.gov.in/sites/default/files/publication_reports/Monthly%20Bulletin%20PLFS%20July%202025.pdf
Figure 6: Worker Population Ratio - Age 15-29 Years (Rural + Urban)
Source :Monthly Bulletin Periodic Labour Force Survey (PLFS) JULY 2025 https://www.mospi.gov.in/sites/default/files/publication_reports/Monthly%20Bulletin%20PLFS%20July%202025.pdf
Unemployment Rate (UR)
The Unemployment Rate (UR) represents the percentage of the labour force that is jobless but actively seeking employment. It is one of the most important economic indicators, as it reflects the overall health of the labour market and, by extension, the economy. A high unemployment rate suggests that a significant share of the working-age population is unable to secure jobs, while a low rate signals a stronger labour market with greater employment opportunities.
Under the Current Weekly Status (CWS) approach, the unemployment rate provides an average snapshot of unemployment over a short reference period of seven days. A person is considered unemployed if, during the reference week, they did not work for even one hour on any day but were available for work and actively sought employment.
Figure 7: Unemployment Rate - Age 15-29 Years (Rural)
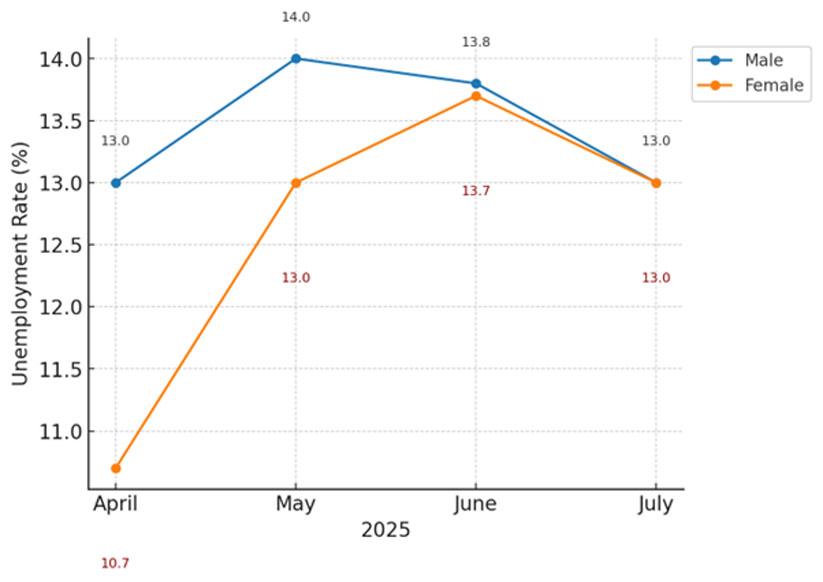
Source :Monthly Bulletin Periodic Labour Force Survey (PLFS) JULY 2025 https://www.mospi.gov.in/sites/default/files/publication_reports/Monthly%20Bulletin%20PLFS%20July%202025.pdf
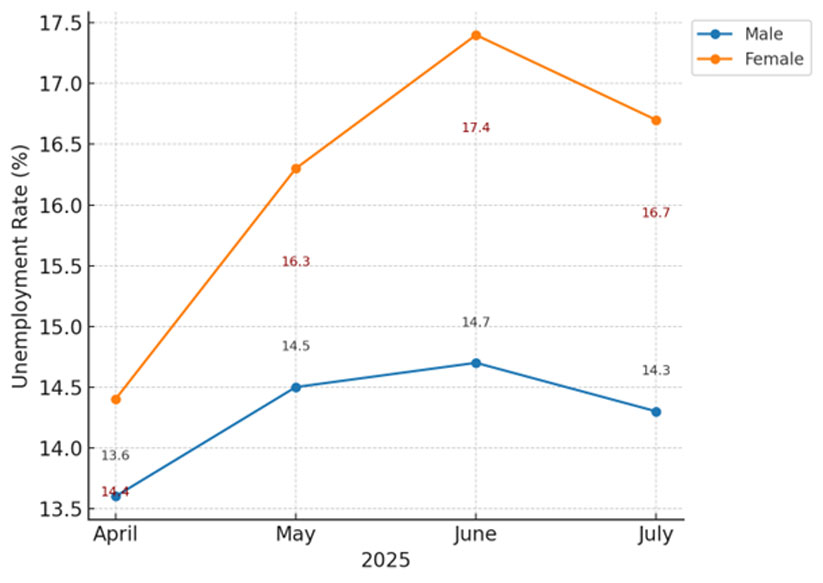
Figure 8: Unemployment Rate - Age 15-29 Years (Urban)
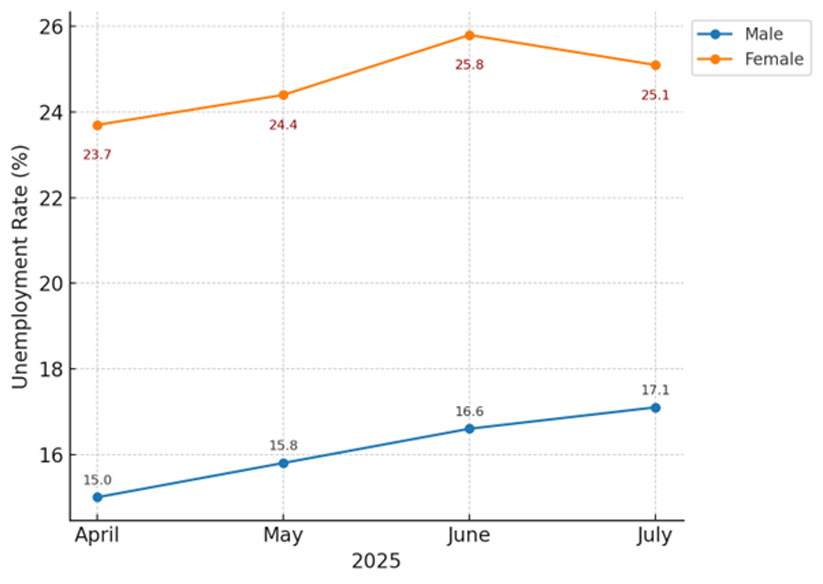
Source :Monthly Bulletin Periodic Labour Force Survey (PLFS) JULY 2025 https://www.mospi.gov.in/sites/default/files/publication_reports/Monthly%20Bulletin%20PLFS%20July%202025.pdf
Figure 9: Unemployment Rate - Age 15-29 Years (Rural + Urban)
Source :Monthly Bulletin Periodic Labour Force Survey (PLFS) JULY 2025 https://www.mospi.gov.in/sites/default/files/publication_reports/Monthly%20Bulletin%20PLFS%20July%202025.pdf
The trends which show a decline in LFPR, WPR and a Rise In UR is reflective of a larger slowing down of the sectoral trends with the infrastructure sector showing a growth of only 2% The combined Index of Eight Core Industries (ICI) increased by 2.0 per cent (provisional) in July, 2025 as compared to the Index in July, 2024. The production of Steel, Cement, Fertilizer and Electricity recorded positive growth in July, 2025.( source: Index of Eight Core Industries ( 2011-12=100) For,July 2025,PIB Aug 20,2025,Min of Commerce & Industry https://www.pib.gov.in/PressReleasePage.aspx?PRID=2158423)
The ICI measures the combined and individual performance of production of eight core industries viz. Coal, Crude Oil, Natural Gas, Refinery Products, Fertilizers, Steel, Cement and Electricity. The Eight Core Industries comprise 40.27 percent of the weight of items included in the Index of Industrial Production (IIP).
The final growth rate of the Index of Eight Core Industries for June 2025 was observed at 2.2 per cent. The cumulative growth rate of ICI during April to July, 2025-26 is 1.6 per cent (provisional) as compared to the corresponding period of last year.
A gist of the Index of Eight Core Industries is given below:
Coal - Coal production (weight: 10.33 per cent) declined by 12.3 per cent in July, 2025 over July, 2024. Its cumulative index declined by 3.1 per cent during April to July, 2025-26 over the corresponding period of the previous year.
Crude Oil - Crude Oil production (weight: 8.98 per cent) declined by 1.3 per cent in July, 2025 over July, 2024. Its cumulative index declined by 1.7 per cent during April to July, 2025-26 over the corresponding period of the previous year.
Natural Gas - Natural Gas production (weight: 6.88 per cent) declined by 3.2 per cent in July, 2025 over July, 2024. Its cumulative index declined by 2.6 per cent during April to July, 2025-26 over the corresponding period of the previous year.
Petroleum Refinery Products - Petroleum Refinery production (weight: 28.04 per cent) declined by 1.0 per cent in July, 2025 over July, 2024. Its cumulative index declined by 0.3 per cent during April to July, 2025-26 over the corresponding period of the previous year.
Fertilizers - Fertilizer production (weight: 2.63 per cent) increased by 2.0 per cent in July, 2025 over July, 2024. Its cumulative index declined by 2.2 per cent during April to July, 2025-26 over the corresponding period of the previous year.
Steel - Steel production (weight: 17.92 per cent) increased by 12.8 per cent in July, 2025 over July, 2024. Its cumulative index increased by 8.5 per cent during April to July, 2025-26 over the corresponding period of the previous year.
Cement - Cement production (weight: 5.37 per cent) increased by 11.7 per cent in July, 2025 over July, 2024. Its cumulative index increased by 8.9 per cent during April to July, 2025-26 over the corresponding period of the previous year.
Electricity - Electricity generation (weight: 19.85 per cent) increased by 0.5 per cent in July, 2025 over July, 2024. Its cumulative index declined by 1.0 per cent during April to July, 2025-26 over the corresponding period of the previous year.
Most core industries registered a decline but a positive trend in the fertiliser,cement,steel and electricity shows that these sectors have responded to policies,investments and the sectoral demand linkages. From the employment perspective certain core sector industries - fertiliser,cement, power and steel - have contributed to the growth of the economy but their impact on youth employment has not been felt so far.
The Future of Jobs Report 2025 brought out by the World Economic Forum (WEF) states that digital access, geopolitical tensions and climate-mitigation efforts are the primary trends expected to shape the future of jobs in India by 2030. Similar to global trends, Indian companies are heavily investing in AI, robotics and autonomous systems, and energy technologies.
Employers in India are also hoping to outpace global adoption in certain technologies, with 35% expecting semiconductors and computing technologies and 21% expecting quantum and encryption to transform their operations. The country’s projected emerging areas for job roles – including Big Data Specialists, AI and Machine Learning Specialists, and Security Management Specialists – align closely with these trends. To address talent needs, companies operating in India expect tapping into diverse talent pools (67%, compared to 47% globally) and adopting skills-based hiring by removing degree requirements (30%, compared to 19% globally) to be effective.
Two demographic shifts are increasingly seen to be transforming global economies and labour markets: aging and declining working-age populations, predominantly in the developed economies, and expanding working-age populations, predominantly in the less developed economies. These trends throw up diverse opportunities resulting in an increase in demand for skills in talent management, teaching and mentoring, and motivation and self-awareness. Aging populations drive growth in healthcare jobs such as nursing professionals, while growing working-age populations fuel growth in education-related professions, such as higher education teachers. .[i]
Will India be able to respond to these shifts? If future jobs are to be created and protected, skill development and employment planning will have to take into consideration these realities.
[i]Future of Jobs Report 2025 INSIGHT REPORT JANUARY 2025,World Economic Forum.p 68,https://www.weforum.org/publications/the-future-of-jobs-report-2025/digest/
[ii]Future of Jobs Report 2025 INSIGHT REPORT JANUARY 2025,World Economic Forum.p 68,https://www.weforum.org/publications/the-future-of-jobs-report-2025/digest/
(The writer is a retired Special Secretary, Government of India. Views expressed are personal. He can be reached at ppmitra56@gmail.com)


Post a Comment