COVID-19 and South Asian exports in Asian perspective: Maldives most integrated country, Pakistan least
The data for South Asia shows that Maldives is the most globally integrated country in the region followed by Nepal, India, Sri Lanka, Bhutan, Bangladesh and Pakistan in terms of the average percentage of exports that formed part of the global value chain during the period 2019-2021.
 Mar 06, 2023

This is an attempt to study exports from South Asia from the Asian perspective during COVID-19 by bringing out the trends in domestic and foreign value-addition and global integration through participation in the value chains. The data trends show that countries of South Asia and other parts of Asia could be divided into five broad groups depending on their participation in the global value chains.
In our analysis, we have described countries that have consistently participated in global value chains since 2010 and have shown progressively a positive or a higher trend in terms of the percentage of exports covered by global value chains as globally more integrated as compared to other countries whose participation in the global value chains does not show progressively a positive or a higher trend.
Accordingly, countries have been put into five groups :
1) Globally more integrated since 2010,
2)less globally integrated but had an increase in domestic value-addition in exports and re-exports absorbed abroad, based on trends during 2019-2021
3)More globally integrated but had an increase in domestic value-addition in exports and re-exports absorbed abroad, based on trends during 2019-2021
4)More globally integrated but had a decline in foreign value-addition in exports absorbed abroad, based on trends during 2019-2021,
5) Countries that have got more globally integrated but witnessed an increase in foreign value-addition in exports absorbed abroad based on trends during 2019-2021
1) Countries that have got globally more integrated since 2010
Bhutan, Nepal, Philippines, Vietnam, Cambodia, Japan, Republic of Korea, China, Kyrgyz Republic and Fiji
2) Countries that have got less globally integrated but have increased their domestic value-addition in exports and re-exports absorbed abroad based on trends during 2019-2021
Bangladesh, Nepal, Sri Lanka, Maldives, Kazakhstan and none of the countries from East and South East Asia and Pacific.
3)-Countries that have got more globally integrated but have increased their domestic value-addition in exports and re-exports absorbed abroad based on trends during 2019-2021
Bhutan, Pakistan, Indonesia, Singapore, Hongkong, Taipei, Fiji and none of the countries from East Asia, Caucasus and Central Asia
4)Countries that have got more globally integrated but witnessed a decline in Foreign value-addition in exports absorbed abroad based on trends during 2019-2021
Pakistan, Indonesia, Singapore, Hongkong, Taipei and none of the countries from other parts of Asia.
5) Countries that have got more globally integrated but witnessed an increase in foreign value-addition in exports absorbed abroad based on trends during 2019-2021
India, Malaysia, Philippines, Thailand, Vietnam, Cambodia, Japan, Republic of Korea, China, Kyrgyz Republic, and Fiji.
The data for South Asia shows that Maldives is the most globally integrated country in the region followed by Nepal, India, Sri Lanka, Bhutan, Bangladesh and Pakistan in terms of the average percentage of exports that formed part of the global value chain during the period 2019-2021. Participation in the value chain brought mixed results for South Asia during this period. While six out of seven countries suffered a steep fall in exports in 2020, Pakistan did not witness a such decline. Data showed that it had been one of the least integrated countries in South Asia, only next to Bangladesh from 2019 to 2020.
The experience of countries in different parts of Asia showed that most countries except Vietnam in Southeast Asia and China in East Asia, despite remaining highly globally integrated suffered a steep fall in exports in 2020 when COVID-19 first struck. The average percentage fall in exports in 2020 has been for countries in South Asia(20.8), and South East Asia(9.8). East Asia (7.5) and Caucasius&Central Asia(20.6)The average percentage rate of recovery in 2021 has been for South Asia (26.4) Southeast Asia (18.7), East Asia (24.5) Caucasus and Central Asia (40.5.).The overall average percentage rates of recovery between 2020 and 2021 have been South Asia (2.8), Southeast Asia(4.5), East Asia(8.5), and Caucasius& Central Asia(9.9).
The average percentage of global integration during the period 2019-2021 has been South Asia(32.0), and South East Asia(48.5).East Asia(36.2) and Caucasius¢ral Asia(45.6).Not only the levels of global integration but the nature of global integration has remained integral to the entire process of decline and recovery of exports. While COVID-19 affected all parts of the world, its impact across regions and across sectors has varied and the export sector has been no exception. An important reason for t differential impact of COVID-19 across Asia could be the nature of globalisation and the proximity of supply chains.
Southeast Asia and East Asia which have higher levels of global integration as compared to South Asia also have supply chains in closer proximity to each other and therefore may have withstood the disruptions of COVID-19 better than South Asia which mostly has trade links with countries of the West and the Middle East which are not in as close proximity as the countries of Southeast Asia and East Asia. The countries of the Caucasus and Central Asia also have similar advantages of global integration and proximity of supply chains like those of countries of Southeast Asia and East Asia.
Table: Export structure of Asian countries ( 2019-2021)
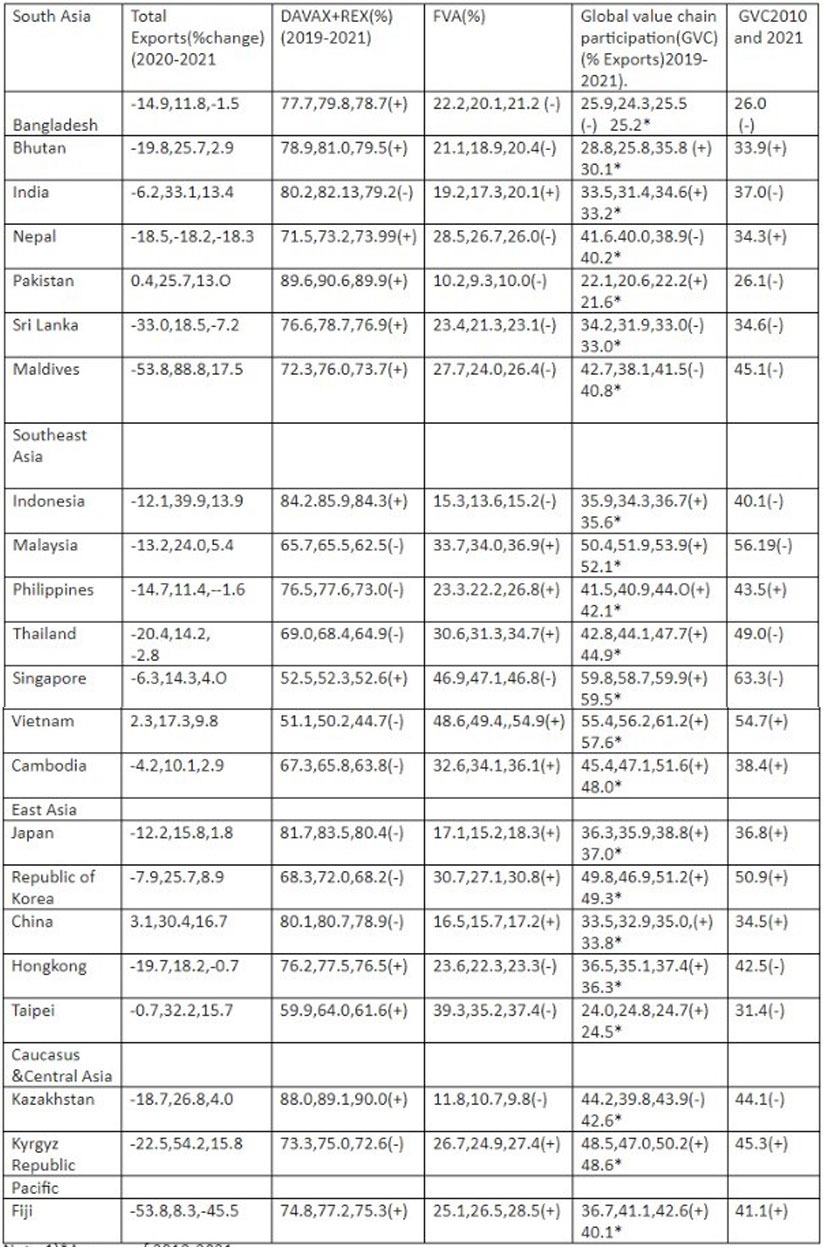
Note:1)*Average of 2019-2021
2)Data for Afghanistan is not available
3) Figures in U S dollars
4) Abbreviations used are DAVAX = domestic value-added immediately absorbed by the direct importer; FVA = foreign value-added; REX = re-exported domestic value-added absorbed abroad.
Source: Key Indicators for Asia and the Pacific 2022, Asian Development Bank,(Tables 3.1.1 and3.1.4)
(The writer, a retired Indian Economic Service officer, is an expert on labour and employment. Views are personal. He can be reached at ppmitra56@gmail.com)


Post a Comment