South Asia in the Asian perspective: Macroeconomic policies and the triple crisis (Part I of a two-part analysis)
South Asia has no strong trade ties within the region, unlike many parts of Asia, and more particularly the developed parts of Asia, namely Southeast Asia and East Asia. South Asia, therefore, has to formulate its own macroeconomic policies to sustain growth keeping in mind global economic trends.
 Jul 26, 2023
")
South Asia is the central theme of this analysis with comparisons between different regions of Asia which include Southeast Asia,East Asia,Caucasus Central Asia and Pacific Asia.A total of 25 countries have been taken into consideration from different regions of Asia to do the comparative analysis over a period ranging from 2000 to 2020.
Contextual framework
The period of this study also coincides with a triple crisis - the Asian financial crisis of late 90s; the global financial crisis of 2008; and the onset of the COVID-19 pandemic in 2020.Our objective is to examine how South Asia performed economically in comparison to other regions of Asia during the 20-year period ( 2000 to 2020 ) in the overall context of the triple crisis .
The Asian Development Bank(ADB) database has been taken for the economic analysis from two sources –(i) The Key Indicators Database (KIDB) is ADB's central statistical database for macroeconomic and social indicators from across Asia and the Pacific (updated April 2023)and(ii) Economic Insights from input-output tables for Asia and the Pacific(July 2022). This publication features a broad range of statistical indicators characterizing the supply-and-use linkages of economic sectors within and across countries of Asia and the Pacific.
We have taken for our analysis 25 countries across different parts of Asia These 25 countries include 8 from South Asia (Bangladesh,Sri Lanka Bhutan, Nepal Maldives ,Pakistan,Afghanistan India ); 9 from Southeast Asia (Malaysia, Indonesia, Thailand, the Phillipines, Singapore, Laos ,Cambodia Vietnam ,Brunei); 5 from East Asia (South Korea,Taiwan, Hongkong China, Mongolia); 2 from Central Asia (Kazakhstan, Kyrgyzstan) and 1 from the Pacific (Fiji).The data has been collected from these two sources for the years 2000,2007.2010,2013,2016,2019 and 2020.
Methodology :Data coordinates on different groups of indicators have been analysed which cover(1) the areas of Main sources of demand at the macro level
(2) Fiscal trends which includes(i) Government revenue and expenditure,(ii)Social and other expenditure
(3).Balance of payments data with focus on(i) Basic primary and secondary income (ii) current,capital and financial accounts,(iii)balance of goods and balance of servicers(iv) Borrowings and their terms
(4)Important external factors impacting the regions
Limitations of the study: A continuous time series data between the years 2000 and 2020 has not been collected .However the years for which the data has been collected cover the aftermath of the Asian Financial crisis of the late nineties,the Global Financial crisis of 2008 and the onset of COVID -19 pandemic in 2019-2020.No econometric has been used in the analysis. There could be issues of inter- country comparabilty of data so as far as possible percentages have been used for the analysis. The countries chosen to study other parts of Asia other than South Asia may not be fully representative of their respective regions.
(1)Main sources of demand at the macro-level.
Demand at the macro level propelling the economy is generated from multiple sources which include household consumption ,government consumption,gross capital formation(investment) and the foreign trade sector consisting of exports and imports.Of the 25 countries analysed in this study except for 5 countries most countries in Asia taken up for our analysis are household consumption demand driven counties implying that such consumption constitutes more than 50% of the total demand of the country at the macro level.The 5 countries where household consumption demand does not fully drive the economies are Bhutan and Maldives from South Asia, Singapore and Brunei from Southeast Asia and China from East Asia.The countries where household consumption expenditure ranges from 50% to 60% of the total demand are Taiwan,Hongkong and Kyrgyzstan.while Korea falls in the 45 to 55% range.
Consumption driven economies
While most major South Asian economies are consumption driven , the two exceptions- Bhutan and Maldives- despite being not consumption driven have shown opposite features in terms of making investment a key driver of their economies.An estimated 30% of total final demand coming from investment is considered to be a good indicator of investment demand for the country.While Bhutan has been the only South Asian country to have done so,.Bangladesh had come closest to this indicator reaching the range of 27-28 % between 2016 and 2020 while no other country in the region has reached this level. However Sri Lanka, Nepal. Afghanistan and India have witnessed an increasing trend in investment during this period, while Maldives and Pakistan have witnessed a declining trend.
A similar trend in investment has been witnessed in the South East Asian region. Brunei has been the only country that had crossed the 30% mark by 10 percentage points during the period with Singapore coming closest at about 27%. Laos, the Philippines, Thailand Indonesia and Singapore have witnessed an increasing trend in investment during this period.
In East Asia, China and South Korea have exceeded the 30% mark with China exceeding it by about 20%.Mongolia and Taiwan have however witnessed an increasing trend in investment but did not reach the 30% mark.
In Caucasus Central Asia none of the two countries despite witnessing an increasing trend in investment have reached the 30% mark. A similar trend has been witnessed in Pacific Asia.
Savings-investment gap
A major challenge for all economies of the South Asian region is mobilisation of resources for growth either domestic sources or from abroad .The trends in Gross National Savings, defined as gross national income less total consumption, plus net transfers from abroad-of most countries of South Asia show that they have a been lower than their gross capital formation(investment), which implies that they needed more resources for investment..The exception to this trend has ben Pakistan which had invested below its national savings and data for Maldives has not been published.
In Southeast Asia, Malaysia, Thailand, Philippines, Singapore, Brunei had invested below their national savings. In East Asia. South Korea ,Taiwan ,Hongkong and China have also invested below their gross national savings. The lone exception in this region has been Mongolia which invested above its national savings..in Caucasus Central Asia ,one of the countries Kazakhstan has invested above their national savings. In the Pacific, Fiji has in some years invested above its gross national savings.
Some of the countries in South-East and East Asia-- Singapore, Thailand, the Philippines South Korea, Taiwan, China had high rates of Gross National Savings, leaving excess resources over and above their investment levels.
(2) Fiscal trends (i) Government revenue and expenditure,(ii)Social and other expenditure
Domestic resource mobilisation
In South Asia where data is mostly available across countries on central government revenue trends except for Afghanistan and Pakistan where it is consolidated both for the federal and the provincial governments, the focus has been to raise resources through taxation. Although government expenditure as a proportion of GDP has tended to increase in all countries, noticeable variation is observed on the role of taxation in raising revenue. While SriLanka is the only country in the region which seems to have relied less on taxation ,other countries witnessed an increase in the share of tax revenue as a proportion of GDP .Bhutan, Maldives, Nepal and Afghanistan have significantly increased their shares, while other countries –Bangladesh, Pakistan and India have witnessed moderate increases in shares over the period. When COVID-19 set in 2020,Nepal witnessed the maximum dip in the share of taxes followed by Sri Lanka. While most countries witnessed a fall in the shares in 2020, India witnessed a marginal increase.
In Southeast Asia,where data is available on both federal and provincial governments, the region witnessed a higher proportion of tax revenue to GDP in comparison to South Asia. Thailand, the Philippines, Laos, ,Cambodia ,Vietnam have witnessed a growth in the share of revenue from taxation as proportion of GDP with Cambodia witnessing the maximum increase .The countries which witnessed an increase in the share of taxes in GDP also witnessed an increase in the share of government expenditure during the period.
In East Asia data is available on both federal and provincial governments.While Korea, China and Mongolia have increased their taxation revenue as a proportion of GDP,Hongkong has kept it stable while Taiwan has witnessed a fall in the share of tax revenue as a proportion of GDP. While most countries had witnessed a fall in the share of taxes as proportion of GDP with onset of COVID -19 in 2020, Hongkong has been the only exception in the region. Countries in this region which have witnessed an increase in the share of taxes have also witnessed an increase in the share of government expenditure to GDP.
In central Asia the two countries studied show a divergent trend. While Kazakhstan has witnessed a fall in share of taxation along with a fall in the share of government expenditure, Kyrgyzstan has witnessed an increase in both the shares.
The lone country studied in the Pacific Fiji, witnessed an increase in the share of government revenue as well as government expenditure during the period.
Internal borrowings
One can now see how governments in Asia have tackled the revenue shortfall to meet their expenditure requirements. In the South Asia all countries have resorted to internal borrowings as a means to mobilise resources- Sri Lanka, Bangladesh, India, Maldives have been more frequent borrowers as compared to the others.
In other parts of Asia Malaysia. Indonesia, the Philippines. Laos have been frequent internal borrowers in South East Asia and once having resorted to such borrowings have increasingly depended on them. Even countries in the region that did not resort to that frequent internal borrowings had to resort to such borrowings with the onset of COVID-19 in the region. For instance, Singapore which did not have internal borrowings during the period had to undertake such borrowing in 2020.In East Asia similar is the situation in South Korea, Hongkong and Taiwan which had resort to internal borrowings during COVID-19 in 2020. In Central Asia the situation was similar with countries resorting to internal borrowings which increased during COVID-19.In Pacific Asia ,complete information on Fiji is not available.
Social sector expenditure
Analysing government expenditure further, it was seen t that Bhutan and Maldives had a significant share in the GDP followed by Afghanistan ,Nepal and Sri Lanka.. Bhutan and Maldives also registered high growth rates in investment followed by Bangladesh. as we have seen earlier. Both Bhutan and Maldives have high public spending in the social sector consisting of (a)social protection(b) health(c) education and (d)public housing while for Bangladesh it has been a balanced mix between the social sector and the economic sector consisting of expenditure on (a)agriculture,(b)industry (c)electricity and (d)transport.In the rest of Asia, Brunei and Singapore in South East Asia and South Korea and China in East Asia which witnessed significant levels of investment had high public expenditure in the social sector. Other countries such as Indonesia, Thailand .the Philippines where investment as a proportion of total final demand grew, rising public expenditure in the social sector was an important feature of public expenditure.
An important source of mobilisation of resources by countries is from the external sector to pay for imports of goods and services and for servicing external debt We would analyse the balance of payments data of countries to see how countries have mobilised such resources.
(3).Balance of payments (i) Basic primary and secondary income (ii) current, capital and financial accounts, (iii)exports , imports and direction of trade (iv)External Borrowings and their terms
The balance of payments consists of three accounts ,(I)current ,(ii)capital(iii) financial accounts .It summarizes the economic transactions of an economy with the rest of the world.
The current account shows flows of goods, services, primary income, and secondary income between residents and nonresidents
The capital account records acquisitions and disposals of non produced nonfinancial assets, such as land sold to embassies and sales of leases and licenses, as well as capital transfers,which are transfers in which the ownership of an asset (other than cash or inventories) changes from one party to another;. [ii]
The financial account records transactions that involve financial assets and liabilities that take place between residents and non residents and includes direct investment, portfolio investment, financial derivatives (other than reserves) and employee stock options, other investment, SDRs and reserve assets[iii].
(i) Basic primary(BPI) and secondary(BSI) income
BPI and BSI constitute the financial side of what is known as the current account in the balance of payments. BPI refers to the net flow of profits, interest and dividends from investment made by countries in other countries and net remittance flows from migrant workers working overseas BSI refers to net flows by way contributions of membership fees payable to international organisations and transfers by the international organisations to governments, taxes on income ,wealth and other taxes, including fines, penalties and fees received, social contribution payable by non residents. If money is being paid for a service it is recorded as a debit (akin to import) and if money is received it is recorded as credit(akin to exports)
BPI and BSI as sources of income
Data shows that for the South Asia region most countries, except Nepal and Afghanistan, BPI has been negative .In other words most countries in the region had received less primary income than what they have paid to the rest of the world, The reverse is the situation for secondary income. Most countries in the region have received more secondary income than what they have paid to the rest of the world. However, when we combine the two sources of income and express it as a proportion of the balance of trade(BOT which is the difference between exports and imports of goods and services of a country), it is observed that such income as a proportion is positive for most countries in the region except in certain years for Maldives and Bhutan. In other words most countries were able to earn foreign exchange resources through BPI and BSI.
In Southeast Asia, most countries had negative BPI except the Philippines and Brunei while most countries except Malaysia ,Singapore and Brunei had negative BSI. However when we put BPI and BSI together as a proportion of the BOT most countries had negative income except the Philippines ,Laos, Cambodia and Brunei(in certain years),BPI and BSI have not been an important source of foreign exchange inflows in Southeast Asia except for a few countries
In East Asia,. the picture is mixed. While South K orea ,Taiwan and Hongkong had positive BPI and a negative BSI, China and Mongolia had a negative BPI and a positive BSI. When BPI and BSI expressed as proportion of BOT, Taiwan ,Hongkong and South Korea(in certain years) had positive income while China and Mongolia had negative incomes from these sources,
In Central Asia both Kazakhstan and Kyrgyzstan had negative BPIs and positive BSIs. And when both expressed as a proportion of BOT Kazakhstan had negative while Kyrgyzstan had positive income from these sources. .
In Pacific Fiji had negative BPI and positive BSI and when the two are expressed as a proportion of BOT it was positive .
Of the 25 countries in Asia for 14 countries BPI and BSI taken together was a positive source of foreign exchange inflows consistently between 2000 and 2020,of which 7 were from South Asia. 3 from Southeast Asia, 2 from East Asia, 1 each from Central Asia and pacific .Of these 14 countries BPI was positive for 5 countries, 2 of which were from South Asia,1from Southeast Asia and 2 from East Asia. Nepal and Afghanistan in South Asia had positive BPI due to large remittance earnings from its citizens working abroad among other factors. In Southeast Asia, the Philippines was the only country which had a positive BPI due to large overseas remittances from its citizens as one of the factors. In East Asia, Hongkong and Taiwan had positive BPI. due to inflows in the form of returns from oversea investments made by their citizens .
(ii) Current, capital and financial accounts of balance of payments
We have so far dealt with the financial transactions in the current account of balance of payments of countries. In this section we would look into the capital and financial accounts in the balance of payments.
Current account balanced with capital and financial accounts
Turning to South Asia, when one looks at the three accounts of balance of payments that we have mentioned earlier, it is seen that most countries had a deteriorating current account balance during the period but were able to improve the situation through better capital and finance accounts. Such trends imply that while these countries on the one hand had to witness outflow of funds to the rest of the world(ROW) due to payment for goods and services imported from ROW, on the other hand had also witnessed inflow of funds from ROW by way of returns on assets held abroad, and capital flows by way way of investment either direct or in other forms. There was however a variation in this trend for some countries in the region. These countries were Bhutan, Maldives, Pakistan which along with an adverse current account balance also had adverse financial accounts. While Bhutan witnessed an outflow of other investment,, Sri Lanka Maldives and Pakistan witnessed an outflow of both other investment and FDI .(Other investment is a residual category that includes all financial transactions not considered direct investment, portfolio investment, or reserve assets.[iv]
In Southeast Asia, countries faced difficulties in the financial account except Singapore, Brunei and Vietnam. Malaysia and Thailand had current account balances to meet difficulties on the financial account .Financial flows into Capital account, Other Investments, FDI and foreign exchange reserves helped countries in the region in varying degrees to meet their difficulties-Indonesia had difficulties in FDI and current account while the Phillipines had difficulties in financial account . Laos and Cambodia had difficulties on current and financial accounts . All countries in the region except Laos witnessed robust growth in foreign exchange reserves during the period.While most countries witnessed a negative or deteriorating current account balance ( CAB )to GDP ratio except Singapore and Vietnam, the decline has been significant for Laos and Cambodia.
In East Asia, all countries except Mongolia had adverse capital account which was balanced by significant current account surpluses and foreign exchange reserves.Countries in the region except South Korea also had adverse financial account balances in some years primarily due to FDI and Other Investments (Hongkong,China and Mongolia) and Taiwan(Other investments)not flowing into these economies.
In Central Asia,both the countries Kazakhstan and Kyrgyzstan had adverse current account and financial account balances.FDI flows have been negative in these countries .The adverse conditions were met through inflows into capital account and foreign exchange reserves during the period.
In the Pacific Fiji witnessed, an adverse current and financial accounts.These adversities were met through inflows into capital account and foreign exchange reserves.
(iii)Exports , imports and direction of trade
Table 1:Share of trade in GDP
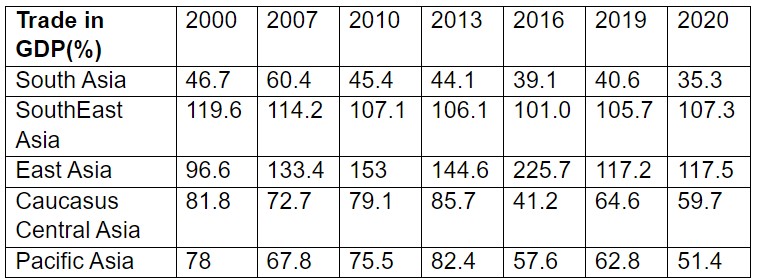
Note :Figures presented in the table are averages for the region
Source:ADB Key indicators data base 2022(Estimated)
Decline in share of trade in GDP
Most regions of Asia, except East Asia, had a decline in the share of trade in GDP between 2000 and 2020.Foreign trade (Exports+imports) as a proportion of GDP has declined in most countries of South Asia. All countries had adverse Balance on the goods account which far exceeded the adverse balance on the services account except for Maldives and India which had a surplus.on services but the surplus did not match up to the adverse balance on the goods account.Most countries in the region did not have a diversified export structure and had one or two major export commodity groups.India had a much more diversified export structure as compared to the rest of the countries in the region.
In Southeast Asia there are broadly 2 groups of countries, those which increased their share of foreign trade as proportion of GDP - PDR Laos,Cambodia,Vietnam and Brunei and the second which reduced the share of trade in GDP - Singapore, Malysia,Indonesia,Thailand and the Phillipines .In the first group of countries except Brunei ,which progressively increased their share of trade in GDP had adverse goods and services account.Vietnam and Cambodia showed trends wherein Vietnam registered surplus on trade for some years while Cambodia registered surpluse in services for some years, Countries which reduced their share of trade in GDP had adverse goods account but surpluses on services account.
In East Asia,most countries except Mongolia saw a dip in their share of trade in GDP after 2013.Hongkong witnessed a fall in the share only after 2016..Most countries except Hongkong in the region had surpluses on the goods account and deficit on the services account while Hongkong had significant surpluses on the services account which exceeded deficit on the goods account..Mongolia had deficits in both the accounts for some years.
In Caucasus, Central Asia both the countries reduced their share of trade in GDP during the period.While they had adverse services account.
In the Pacific, Fiji has also reduced its share of trade in GDP.While it has an adverse goods account ,it services has remained in surplus,except when COVID-19 hit the world.
Direction of trade
The direction of trade marks a distinct difference between South Asia and the rest of Asia.Trade with neighbours has been one of the important features of the Asian region except South Asia . Nepal ,Bhutan and Afganistan were exceptions to this trend in SouthAsia.as trade of these countries with neighboring countries ,particularly exports has been significant..The dependency on imports has been higher on each other in the South Asian region except for Pakistan, Afganistan,Nepal and India..While many countries in the region have shown their preference to trade with US and EU,all of them have increased their share of imports from China.
In the Southeast Asian countries the dependency on neighbouring countries for both exports and imports is much higher but the entry of China has reduced this dependency over the years.Vietnam and Cambodia have significant export earnings from US and EU.In East Asia the trade structure is a bit more diversified as compared to Southeast Asia with exports dependent on three markets,US, EU and China.,particularly for imports.However the rise of China trade is also witnessed in the region.In Caucasus Central Asia trade patterns differ between the two countries. .While for Kazakhstan which is a far less an open economy as compared to Kyrgyzstan ,EU and China were important, for Kyrgyzstan,UK,China and neighbouring countries emerged as important trading partners.An important factor for both the countries is the rise of China and Russia as trading partners.In the Pacific ,for Fiji trade with US.Australia ,NewZealand and China have been significant.
We would next see the share of exports and imports separately in GDP in the different regions of Asia.
Table 2(a) :Share of exports in GDP
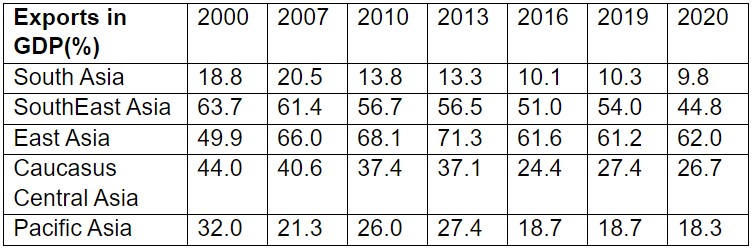
Source:ADB Key indicators data base 2022(Estimated)
Table 2(b):Share of imports in GDP
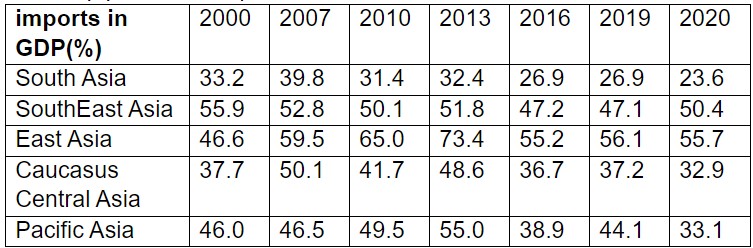
Note :Figures presented in the table are averages for the region
Source:ADB Key indicators data base 2022(Estimated)
Exports and imports to GDP
The data shows that imports as a proportion of GDP have exceeded exports for South Asia,Caucasus Central Asia and Pacific Asia, which are the poorer parts of Asia as the data presented in the table below shows.trade as a proportion of GDP was also lower in these parts as compared to South East Asia and East Asia(Table1).As exports as a proportion of GDP declined in South Asia,Caucasus Central Asia and Pacific Asia during this period the trade gap as a proportion of GDP increased in these regions between 2000 and 2019-SouthAsia(2.2%) Caucasus Central Asia (3.5%)Pacific Asia (11.4%) since exports did not increase as much as imports.However trade as a proportion of GDP witnessed a declined between 2000 and 2020 for all the regions except East Asia..South Asia had the lowest share of trade in GDP as compared to other regions.(Table1).
In 2020 both exports and imports as a proportion of GDP declined as a result of the the COVID-19 pandemic except in East Asia for exports and Southeast Asia for imports.
We have data on factor productivity across countries in Asia measured in terms of the ratio of gross output to value-added which gives the contribution of capital and labour to gross output.Often factor productivity is seen as a reason for firms not being able to compete in markets.
Factor productivity
Output is measured by both value- added and gross output. Value-added excludes intermediate inputs (materials, energy and services used up in the process of production) while gross output includes those inputs. Both the output measures can be used to estimate multifactor productivity (MFP) growth. A value-added output measure gives the contribution of capital and labour(MFP) as inputs to gross output [v]
Table 3:Average factor productivity
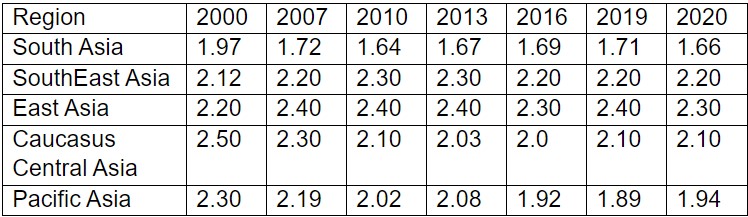
Source: Economic Insights from input-output tables for Asia and the Pacific(July 2022)(Estimated),ADB
While factor productivity could be one of the many reasons for firms not being able to compete,there are many other reasons and factor productivity need not always be held responsible for firms not being able to compete.An important reason could be lack of strong trade relationships between countries and the pull of the domestic market which prompts firms to sell products in these markets rather than abroad.
Table 4:Average Percapita GDP (USD)
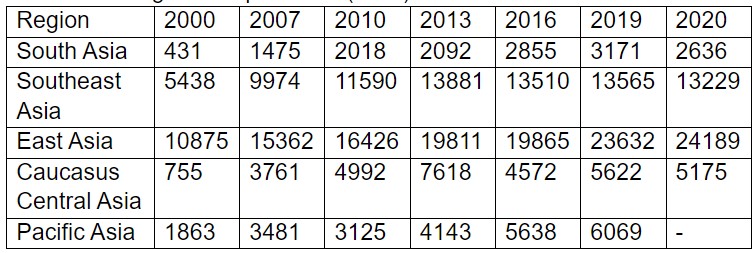
Source:ADB Key indicators data base 2022(Estimated)
While South Asia remains the poorest among all the regions ,it is also least globalized in terms of share in GDP and its growing trade deficit poses policy dilemmas in its path to globalization as with further globalization the prospects of imports going up incrases more than what is exported by the region. The policy options for trade will therefore need careful calibration in keeping with the export potential of the region and the need for imports.
(iv)External Borrowings and their terms
Debt to GNI
The situation on external debt could be viewed on several parameters but we have considered only a few important ones. On these parameters countries of South Asia have shown divergent trends.While the ratio of external debt to Gross national Income (GNI) has remained stable for India and Bangladesh it has grown for Sri Lanka,Bhutan,Maldives and Pakistan. Nepal and Afganistan have reduced high levels of external debt during this period.
In Southeast Asia countries had mixed trends.While Malaysia, Cambodia and Vietnam showed a rising trend ,Indonesia Thailand, PDR Laos and Philippines witnessed a decline. Singapore and Brunei did not report any external debt.In East Asia all countries had rising external debt with Hongkong and Mongolia showing significant increases during the period.In Caucasus Central Asia both countries had high levels of external debt with kazakstan witnessing a rising trend.In Pacific Asia Fiji also witnessed a rising trend .
Tenure of debt
On the tenure of debt ,all countries in South Asia except Bhutan witnessed an increase in short-term debt as a proportion of their total external debt..In Southeast Asia the trend is similar with all countries reporting debt statistics witnessing higher short term borrowings except Indonesia.In East Asia all countries except South korea witnessed increase in short-term debt.In Caucasus Central Asia both countries witnessed a rise while in Pacific Asia Fiji also witnessed arise in short-term external debt except before the COVID-19 pandemic.
Short-term debt
Short-term debt determines to a large extent the debt service burden of a country.While the debt service burden for India and Bangaldesh has declined during the period it has increased for Srilanka ,Bhutan ,Nepal ,Maldives Afganistan and Pakistan.In Southeast Asia debt service burden has reduced for most countries except for indonesia, Laos and Cambodia.In East Asia,except for Mongolia which showed a significant rise in debt service ratio and Taiwan which witnessed a very moderate increase ,China witnessed a decline while South korea and Hongkong did not report the data..In Cuacasius Central Asia while Kazakhstan witnessed a sharp rise in debt service ratio ,Kyrgyzstan witnessed a decline but the level of the ratio had ben high for both the countries. In Pacific Asia ,Fiji showed a significant rise in the debt service burden.
Coming to the other terms and conditions, the situation has been mixed depending on the specific loans contracted and negotiating power of nations.
Grace period of loans
The grace period of loans have increased marginally during the period for India, Pakistan and sharply for Afganistan while for the rest of the countries in the region it has been reduced.The grant element in the loans contracted has increased for most countries but the increase has been least for Maldives and Nepal for they already had high levels of grant.Pakistan had the lowest proportion of grant in its loan portfolio in the region.The maturity period of loans for all countries in the region increased except for Bangladesh , Sri Lanka and Maldives.All countries took advantage of the lower rates of interest during this period.
Grant element and maturity period
On other terms and conditions of debt in Southeast Asia the situation is mixed.Malaysia saw an increase in grace period, grant element but a reduction in maturity period ,while Indonesia saw an increase in grace period and maturity but witnessed a reduction in grant element.Thailand saw a reduction in grace period ,grant element and maturity while Phillipines saw an increase in all.Laos also witnessed a reduction in all 3 conditions Cambodia and Vietnam saw an increase in grant element and maturity but a reduction in grace period.All countries had the advantage of low interest rates except Laos which witnessed a slight increase as it already contracted loans at much lower irates as compared other countries of the region.
In East Asia, the information available for Mongolia and China reveals that while Mongolia saw a reduction in all three terms &conditions China witnessed a reduction in grant element and maturity but an increase in grace period.
In Caucasus Central Asia,Kazakhstan saw a reduction in maturity and grace period but an increase in grant element ,Kyrgyzstan witnessed a reduction in all 3 terms &conditions.
In Pacific Asia,Fiji witnessed an increase in all the three including interest rates.
All 8 (100%)countries in SouthAsian region were able to increase their grant element in the loans while in SouthEast Asia only 4 (57%)of the 7 countries were able to increase and in East Asia none of the 2 countries which reported debt data were able to increase the grant element.In Caucasus Central Asia only one of the two countries was able to increase the grant element while in the Pacific the country analysed was able to increase the grant element.
Reduction of grace period to repay loans has been some what mixed for South Asia and other Asian countries with only 5 out of 8(62%)reporting reduction implying early repayments while in East Asia 4 (57%)out of 7 reported reduction while in East Asia 1,in Caucasus Central Asia 2 reported reduction.In pacific the only country analyzed reported increase in grace period.
There has been a general increase in the maturity period of loans during the period.In South Asia only 3(37.5%) of the 8countries witnessed reduction, in East Asia maturity period increased for 3 (42.7%) of the 7 countries while in East Asia both countries witnessed reduction ,so has ben the case in Caucasus Central Asia while in Pacific Fiji has witnessed an increase.
Short-term debt has increased over the years in most parts of the the region - 7 (85%) out of 8 in South Asia.6(85%) out of 7 in Southeast Asia ,4 (80%) out of 5 in East Asia. .In Caucasus Central Asia and the Pacific, the countries analyzed reported a reduction in short-term debt in their overall debt portfolio.
The analysis shows that in the Asian region while there has been a trend towards an increase in the grant element and maturity period of loans but the region also witnessed a reduction in grace period, which implied that countries had to progressively repay earlier to contract new loans and the dependence on short term borrowings also showed an increase in the overall climate of lower interest rates during the period.which also implied earlier repayment of loans. .
(5) Important external factors impacting the regions
Dip in growth rates
The period witnessed three important developments that were not internal to any country-.These factors were the aftermath of the Asian financial crisis of late 90s which mostly affected countries of SouthEast asia , the global financial crisis of 2008 and the onset of the Pandemic in 2020..Although the impact of the Asian financial crisis and the global financial crisis in the Asian region did not have an impact so as to make the growth rates of GDP go in the negative range, which the COVID-19 pandemic did, nonetheless growth rates after 2013 did witnessed a dip across the region. There was a progressive decline in the growth rates if we consider the average growth rates for the the period (i)2007 ,2010 and 2013 (ii)extend the period to include 2016 (period ii)and (iii) further extend the period to include 2019.(period iii).
The table below gives the growth rates for the three periods for different regions of Asia
Table 5:Growth rates of GDP
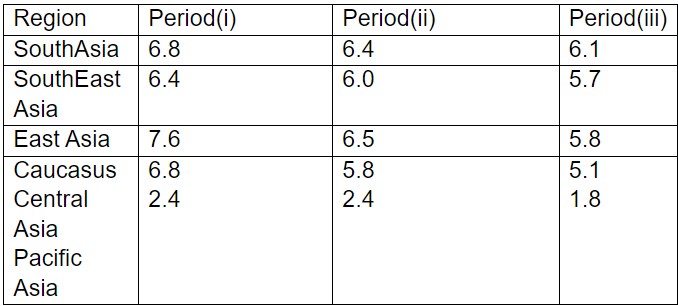
Source:ADB Key indicators data base 2022(Estimated)
It would be observed that there was a progressive decline in growth rates across different regions of Asia before the COVID -19 pandemic affected the world.
An important reason for reduction in growth rates could be the reduction of FDI flows in many countries of Asia post 2013 including China. India, Bangladesh,Nepal, Vietnam ,South Korea were exceptions to this trend. Foreign portfolio investments (FPI) followed the same trend although there were exceptions with FPI finding their investment opportunities in East Asia and Singapore.
The decline in growth rates witnessed in different regions of Asia in 2020, with the onset of COVID-19 pandemic, was the most severe for Pacific Asia(Fiji)(-17.2%) South Asia (-6.9%),Caucasus Central Asia(-5.4%) Southeast Asia(-2.8%) and East Asia(-1.3%)(Figures have been estimated from the same source as table one )
Concluding observations
The analysis brings out that South Asia in the Asian perspective has its own set of challenges. South Asia has no strong trade ties within the region, unlike many parts of Asia, and more particularly the developed parts of Asia, namely Southeast Asia and East Asia. South Asia, therefore, has to formulate its own macro economic policies to sustain growth keeping in mind the global economic trends.
(The writer, a retired Indian Economic Service officer, is an expert on labour and employment. Views are personal. He can be reached at ppmitra56@gmail.com)
References
[i] Nguyen Thi Thuy Hang The Rise of China, Indian Journal of Asian Affairs
Vol. 30, No. 1/2 (June-December 2017), pp. 47-64 (https://www.jstor.org/stable/26465816
[ii] Balance of Payments and International Investment Position Compilation Guide,p250
https://www.imf.org/external/pubs/ft/bop/2014/pdf/BPM6_15F.pdf
[iii]Balance of payments manual (6th Edition) 2013p133-141 https://www.imf.org/external/pubs/ft/bop/2007/pdf/chap8.pdf
[iv] https://www.elibrary.imf.org/display/book/9781557755704/
[v] Trevor Cobbold
A Comparison of Gross Output and Value-Added Methods of Productivity EstimationResearch Memorandum Cat No: GA 511 Nov 2003 Australian Government productivity commission https://www.pc.gov.au/research/supporting/comparison-gross-output-value-added-methods/cgovam.pdf


Post a Comment