South Asia in the Asian perspective: external and internal macro-economic imbalances and the rise of China (Part II of a two-part analysis)
There has been discussion of alternate supply chains being created in India, Indonesia and Vietnam but supply chain issues originating from China are not going to go away in a hurry.
 Jul 28, 2023
")
South Asia is the central theme of this analysis with comparisons between different regions of Asia which include Southeast Asia, East Asia, Caucasus Central Asia and Pacific Asia. A total of 25 countries have been taken into consideration from different regions of Asia to do the comparative analysis over a period ranging from 2000 to 2020.
Contextual framework
Asia has emerged as one of the the focal points of global geopolitics and the economics revolving around it. The big powers - US, China and Russia - have major interests in the region to create allies by establishing links through trade, technology and infrastructure support .An important development during the period of our analysis is the emergence of China [i] in the region as a major global power .The period also coincides with three major crises crisis - the Asian financial crisis of late 90s; the global financial crisis of 2008; and the onset of the COVID-19 pandemic in 2020.
The purpose of this study is to see how South Asia managed the external and internal macroeconomic balances in comparison to other regions of Asia during the 20-year period ( 2000 to 2020 ) in the overall context of the triple crisis and the emergence of China as an important global power.
The Asian Development Bank(ADB) database has been taken for the economic analysis from two sources –(i) The Key Indicators Database (KIDB) is ADB's central statistical database for macroeconomic and social indicators from across Asia and the Pacific (updated April 2023)and(ii) Economic Insights from input-output tables for Asia and the Pacific(July 2022). This publication features a broad range of statistical indicators characterizing the supply-and-use linkages of economic sectors within and across countries of Asia and the Pacific.We have also relied on secondary literature to study the rise of China between 2000 and 2020.
We have taken for our analysis 25 countries across different parts of Asia These 25 countries include 8 from South Asia (Bangladesh,Sri Lanka Bhutan, Nepal Maldives ,Pakistan,Afganistan India ); 9 from Southeast Asia(Malaysia, Indonesia, Thailand ,Phillipines, Singapore, Laos ,Cambodia Vietnam ,Brunei); 5 from East Asia (South Korea,Taiwan, Hongkong China, Mongolia); 2 from Central Asia (Kazakhstan, Kyrgyzstan) and 1 from the Pacific (Fiji).The data has been collected from these two sources for the years 2000,2007.2010,2013,2016,2019 and 2020.
Methodology :Data coordinates on different groups of indicators have been analysed which cover the main sources of external and internal macroeconomic balances.
Limitations of study: A continuous time series data between the years 2000 and 2020 has not been collected .However the years for which the data has been collected cover the aftermath of the Asian Financial crisis of the late nineties,the Global Financial crisis of 2008 and the onset of COVID -19 pandemic in 2019-2020.No econometric has been used in the analysis. There could be issues of inter- country comparabilty of data so as far as possible percentages have been used for the analysis. The countries chosen to study other parts of Asia other than South Asia may not be fully representative of their respective regions.
Monetary demand , agricultural supplies and price stability
In this section one shall see how countries have regulated money supply to control demand and bring price stability as a part macro-economic management strategies in their quest to generate growth. Data is available on the proportion of money supply to GDP which is an indicator of the extent to which cash economy has spread We also have information on rate of change of money supply in the economy which shows the extent to which governments have regulated money supply.Data on m2 and m3 is available, Money and quasi-money (m2) comprise the sum of currency outside banks( in circulation ), demand deposits other than those of the central government, and the time, savings, and foreign currency deposits of resident sectors other than the central government Broad money (M3) includes currency, deposits with an agreed maturity of up to two years, deposits redeemable at notice of up to three months and repurchase agreements, money market fund shares/units and debt securities up to two years.[ii]
Price instabilty
Our analysis shows that countries in South Asia witnessed price instabilty whenever there has been an increase in money supply accompanied with a decline in agriculture production.The main reason being that South Asian economies are mostly agrarian economies and agriculture prices particularly food prices constitutes an important element in the consumer expenditure of poorer families..So a fall in agriculture production which brings with it a fall in crop prduction is likely raise food prices unless there is a significant buffer stock of food grains or food grain imports take place to take care of domestic shortages and price instabilty. Bangladesh,Bhutan,Nepal,Maldives and India attempted to control the growth of money supply but agricultural supplies in the light growth of money supply boosted demand to raise prices and bring in price instabilty. Sri Lanka and Pakistan had high growth of money supply along with agricultural supplies not keeping up pace with demand due to growth in money supply, thereby experiencing price instabilty. Afghanistan attempted to control the growth of money supply after 2010 and witnessed relative price stability during this period in the face of better agricultural supplies.
In Southeast Asia, Laos ,Cambodia and Vietnam witnessed price instabilty due to high growth in money supply without adequate agricultural supplies.Other economies of the region could manage prices better but also attempted to control growth of money supply except Singapore which had price stability despite higher growth in money supply. In East Asia, countries saw price stabilty due to better macro-economic management despite increases in the rates of growth of money supply and fall in agricultural production in certain countries. In Caucasus Central Asia both countries witnessed price instabilty and steep rises in growth of money supply.However, with better agricultural production Kyrgyzstan was able to control prices after 2010.In the Pacific,Fiji despite weak agricultural production it was able to bring in r price stabiilty by controlling the growth of money supply which regulated demand.
Table 1:Indicators of macro-stability
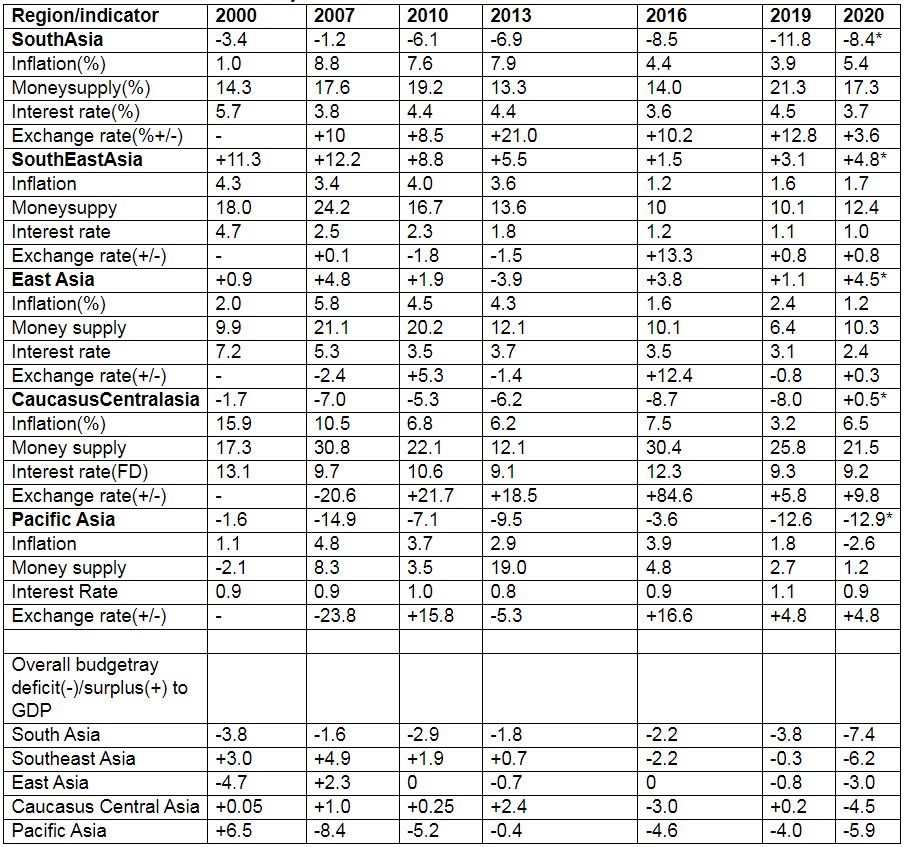
· Current account balance/GDP(%)
Source:ADB Key indicators database 2022(Estimated)
Inflation
The data on different macro-stability parameters presented in the above table brings into focus the policies adopted by the different regions particularly in respect of internal and external macro-economic management of the economy.Control of inflation by raising interest rates and demand management by restricting the growth of money supply are important monetary tools of internal macro management.
The average inflation in the South Asian region ( 5.6%.).Southeast Asia(2.8%).East Asia(3.1%).Caucasus Central Asia(8.1%)and Pacific Asia(2.2%) has made countries restrict the growth of money supply in some regions,particularly Pacific Asia,Southeast and East Asia .the data shows that the average growth of money supply was South Asia (16.7%),Southeast Asia(15%).East Asia(12.9%),Caucasus Central Asia(22.8%) and Pacific Asia(5.3%).
Interest rates
Interest rates,however, have been progressively reduced across the regions except Pacific Asia where it has been relatively stable and rising in some years. The real interest rate (Actual interest rate-Inflation) which is in the negative range shows that inflation is eroding the value of assets in the region SouthAsia(-1.3%) Southeast Asia(-0.2%).East Asia(+1.0%) ,Caucasus Central Asia(+2.4%) and Pacific Asia(-1.3%).The rate in Caucasus central Asia is higher as compared to other regions as the rates are available for time deposits while the rest of Asia the interest rate is for savings account.
Budget deficits
Internal macro-instability caused due to overall budgetary deficits which is the gap between governments spending and revenues is also an important concern in the region, particularly in South Asia and Pacific Asia. However, with the onset of the COVID-19 pandemic in 2020, all regions in Asia witnessed adverse fiscal balances due to the sudden rise in government expenditure compared to revenues to meet the emergent situation arising out the pandemic.Sometimes when local,resources by way of domestic borrowings are not sufficient to bridge the budgetary gap, external borrowings are resorted to and therefore the domestic macro instability spills over into the external sector causing pressure on the balance of payments and even exchange rates as well as interest rates abroad.in any case internal borrowings not backed up by asset creation or supply of goods could add to the money supply by way of increased government spending, which could result in a rise in prices of goods and services , resulting in inflationary expectations.
Current account deficits and surplus
On the external macro stability side, the average Current account deficit(-)/surplus (+) (A current account deficit occurs when a country sends more money outside than it receives due to payments for goods and services that it imports and current account surplus occurs when a country receives more money from outside than what it pays due to imports of goods and services) of regions shows that South Asia(-6.6%), Southeast Asia(+6.7%), East Asia(+2.2%)Caucasus Central Asia(-5.2%) and Pacific Asia(-8.8%).The average exchange rate depreciation (+)/appreciation(-) in the region(+11%) ,Southeast Asia(+1.7%),East Asia(+1.9%).Caucasus Central Asia(+19.9) and Pacific Asia(+2.1)The regions which experienced maximum depreciation of their currency -South Asia and Caucasus Central Asia also witnessed maximum current account deficit. Pacific Asia has been different as despite its relatively stable currency its current account deficit has been high.
Trade deficit and surplus
Trade deficit is the largest component of a current account deficit, which occurs when a country imports more than it exports in a given period of time. Our estimates show that the gap between exports and imports which is the trade deficit as a proportion of GDP for different regions of Asia was SouthAsia(-16.7%),Southeast Asia(+5.8),East Asia(+4.0%), Caucasus Central Asia(-6.8%) and Pacific Asia(-21.5%).
South Asia and Caucasus Central Asia had two sources of external instabilty in the form of currency depreciation and trade deficits while Southeast Asia and East Asia had lower depreciation of their currencies during the period but had trade surpluses which stemmed any impact of external macro instability in these regions..Pacific Asia despite having a relatively stable currency suffered from trade deficit , which led to external outflow of funds due to imports. Any such outflows not backed up by inflows are likely to cause external macro instability.
The rise of China
The table below shows the significance of China as trading partner in the region between 2000 and 2020.
Table 2: Percentage Increase in Share of Exports and Imports to China
2000 and 2020
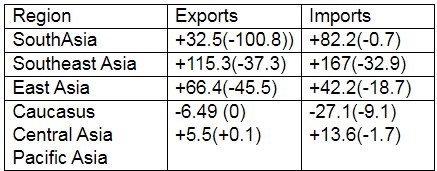
Figures in brackets give the share of US exports and imports
+ %increase.- %Decrease
Source: ADB Key indicators database 2022(Estimated)
The data in table 3 shows that China has emerged as an important trading partner in the region while the importance of the US as a trading partner has become less important over the years. It also shows that regions have become more dependent on imports from China than on exports to that country. except East Asia.
South Asia has been one of the dependent regions on China for imports along with Southeast Asia. However China does not depend on south Asia on imports but has gradually increased its exports to that region over the period. It has however a much stronger trade relations with East and Southeast Asia and its imports from that region as a proportion of total imports exceeded exports in 2020.
Short-term borrowings by China
.An important factor that has propelled China in its growth path during this period is its heavy dependence on short-term borrowings.The proportion of short-term debt in its total external debt increased from 9 % to 52% between 2000 and 2020 and even going upto as high as 73 % in 2013. Countries that have high short-term external debt depend on exports or other foreign exchange earnings to repay their debt. China has however taken advantage of the falling interest rates globally in contracting external debt but its debt servicing ratio went up after 2013 as global interest rates hardened after dipping sharply between 2000 and 2013.The focus of China therefore had to be exports and export-oriented industrialisation dependent on FDI and foreign capital flows. Its gross national savings and gross capital formation increased progressively during the period.China’s FDI has increased from 37.4 billion USD to 218 Billion USD in 2013 after which there has been a decline and was about 99 billion USD in 2020.
China’s economic policies
The contours of China’s economic policies were to attract export-oriented foreign investors; and to increase international competitiveness of domestic exports.Its policies are centred around creating infrastructure in the form of Special economic zones (SEZs) and economic development zones (EDZs) which are areas with preferential business policies that differ from those governing the country as a whole.The country initially experimented with such zones in the 1970s, and has since has created a range of EDZs to attract foreign direct investment (FDI) and boost domestic production for exports.SEZs are only seven in number, cover much larger areas, and tend to have more generalized policies rather than incentives for specific sectors. For example, China’s first SEZ was set up in Shenzhen, which now covers the whole city and primarily provides a preferential tax environment for manufacturers oriented towards export markets across a wide range of industries.
ETDZs, however, tend to focus on providing incentives for specific kinds of activities, such as international trade, utilizing local resources, or developing technological innovation. There are almost 200 national-level ETDZs, each of which covers a much smaller area than an SEZ ETDZs provide a broad range of FDI incentives, which vary depending on the specific EDZ. Businesses operating in EDZs can expect, among other incentives, a higher level of autonomy over their operations, a variety of tax exemptions, land and building subsidies, and preferential employment policie.’As a result of these measures export base has become diversified from an initial heavy reliance on textiles and other light manufacturing. In the early 1990s, light manufacturing accounted for more than 40 percent of China’s exports. These products largely consisted of footwear, clothing, toys, and other miscellaneous manufactured articles. A large part of the remaining exports was accounted for by manufactured goods (mostly textiles) and machinery and transport (small electronics). In recent years, China has made substantial gains in other export categories, including more sophisticated electronics (office machines and automated data processing equipment, telecommunications and sound equipment, and electrical machinery), furniture, travel goods, and industrial supplies[iii.]
China’s entry into international trade organizations and trade agreements
China’s entry into global trade became a reality with its joining the World Trade Organization (WTO) on December 13, 2001. With China joining the WTO the process of internal economic reform in China was accelerated With these reforms, China attracted substantial domestic and foreign investment and expanded its international trade significantly..[iv]
Another important development was the formation of Regional Comprehensive Economic Partnership (RCEP) which includes the 10 nations of the ASEAN, Australia, Japan, New Zealand, South Korea, and China. The countries involved in the agreement accounted for nearly 30% of global GDP in 2019, topping NAFTA as the world's largest trade block[v]
Other major regional trade agreements measured by the share of global GDP are the South American trade bloc Mercosur (2.4%), Africa’s continental free trade area (2.9%), the European Union (17.9%) and the United States-Mexico-Canada Agreement (28%)[vi].
China’s Belt and Road Initiative (BRI)
BRI is one of the most ambitious infrastructure projects ever conceived. Launched in 2013 , it was originally devised to link East Asia and Europe through physical infrastructure. since the project has expanded to Africa, Oceania, and Latin America, significantly broadening China’s economic and political influence. As of date 147 nations which account for for two-thirds of the world’s population and 40 percent of global GDP have signed into the BRI or indicated an interest in doing so Some countries have sought to balance their concerns about. Meanwhile, India has provided its own development assistance to neighbors, most notably Afghanistan on infrastructure projects. India is a counterweight to a China-dominated Asia and has sought to knit together its strategic relationships in the region, most recently via the 2022 indo-Pacific economic Framework. Tokyo has a similar strategy to New Delhi’s, balancing its interest in regional infrastructure[vii.] Together with India, Japan has also agreed to cultivate the Asia-Africa Growth Corridor (AAGC), a plan to develop and connect ports from Myanmar to East Africa.[viii]
Supply chain issues
The supply chain problems created by China’s strict COVID-19 policies have led some multinationals to reassess the practice of offshoring manufacturing capacity. The first signs of diversification and “friend-shoring” are seen in sectors that have attracted large amounts of FDI in the past (electric vehicles, clean technology components, semiconductors, etc.).
There has been discussion of alternate supply chains being created in India, Indonesia and Vietnam but supply chain issues originating from China are not going to go away in a hurry. One of the important reasons being Vietnam, along with the rest of Asia, imports a lot of basic industrial products such as chemicals and plastic, from China. Over the years, China’s ambitions to climb the value chain meant a shift of its production toward higher-end equipment and industrial goods. It has built out a vast manufacturing sector that supplies a significant portion of components, or intermediate goods, that go into final products that are manufactured in Asia and other parts of the world,[ix]
Concluding observations
Although the data spread of our analysis does not cover the entire spectrum of current-day economics and politics the analysis does bring out the rise of China as a global power and the changes that such a rise has brought into play in shaping the modern-day discourse on trade and politics. While macro-stabilty factors have essentially been seen through the monetary prism yet real factors are important. Goods and supply chain issues are important and determine to a large extent the internal and macro-stability of an economy.The monetary factors need to be fine-tuned taking into consideration the supplies of goods and commodities both through domestic production and imports.The fine-tuning of real and monetary factors seems to be emerging as the key message in maintaining the internal and external macro stability of regions and also shaping global politics and economics by making supply chains and strategic allies an important part of the power play.
(The writer, a retired Indian Economic Service officer, is an expert on labour and employment. Views are personal. He can be reached at ppmitra56@gmail.com)
References
[i] Nguyen Thi Thuy Hang The Rise of China, Indian Journal of Asian Affairs
Vol. 30, No. 1/2 (June-December 2017), pp. 47-64 (https://www.jstor.org/stable/26465816
[ii]OECD Data,https://data.oecd.org/money/broad-money-m3.htm
[iii] https://www.china-briefing.com/news/chinas-economic-development-zones-types-incentives/
[Iv] Alan Wolff.this is China’s20 th anniversary of joining WTO,What will the 25th Anniversary look like,Peterson institute of international Economics(PIIE)Dec
[v] Tobias Sytsma RCEP Forms the World's Largest Trading Bloc. What Does This Mean for Global Trade? Dec 9,2020https://www.rand.org/blog/2020/12/rcep-forms-the-worlds-largest-trading-bloc-what-does.html
[vi] Asia-Pacific partnership creates new ‘centre of gravity’ for global trade.UNCTAD https://unctad.org/news/asia-pacific-partnership-creates-new-centre-gravity-global-trade,Dec 15,2021
[vii] James Mcbride, Noah Berman, and Andrew Chatzky China’s Massive Belt and Road Initiative,Council for foreign reltions.feb 2.2023
https://www.cfr.org/backgrounder/chinas-massive-belt-and-road-initiative
[viii]China’s Dominance In Global Supply Chains Won’t Change Anytime Soon ‘Maritime gate way; Aug 29,2022,https://www.maritimegateway.com/
[ix ]Ibid


Post a Comment